Number of Prisons per State (USA) and Rate of Incarceration
—
Project Description
The prison crisis in the United States is one that has caught the eye of the public and many social scientists. There have been problems all over with overcrowding, poor living or working conditions(sometimes both!), and wrongful imprisonment. This project just scratches the surface of these issues but looking just at the spatial component of prisons and inmates per state around the United States. The three states with the highest rate of incareration/1000 people are Oklahoma, Louisiana, and Mississippi all clock in over 1000 people. The three states with the lowest rates are Massachusetts, Vermont, and Rhode Island. Right away we can see that these two catergories are already connected over space.
We then look at the next layer and can see that most of the prisons are in the Mid-Atlantic/Southeast(sans Florida) region. If most of the incarcerated population is situated in the South then why are most of the prisons in a different region? This points to the problem of overcrowding in high-incarceration populations. We then look to the Northeast region and see that the concentration of people in prisons decreases and the number of prisons also decreases, which adds up more than it does in the South.
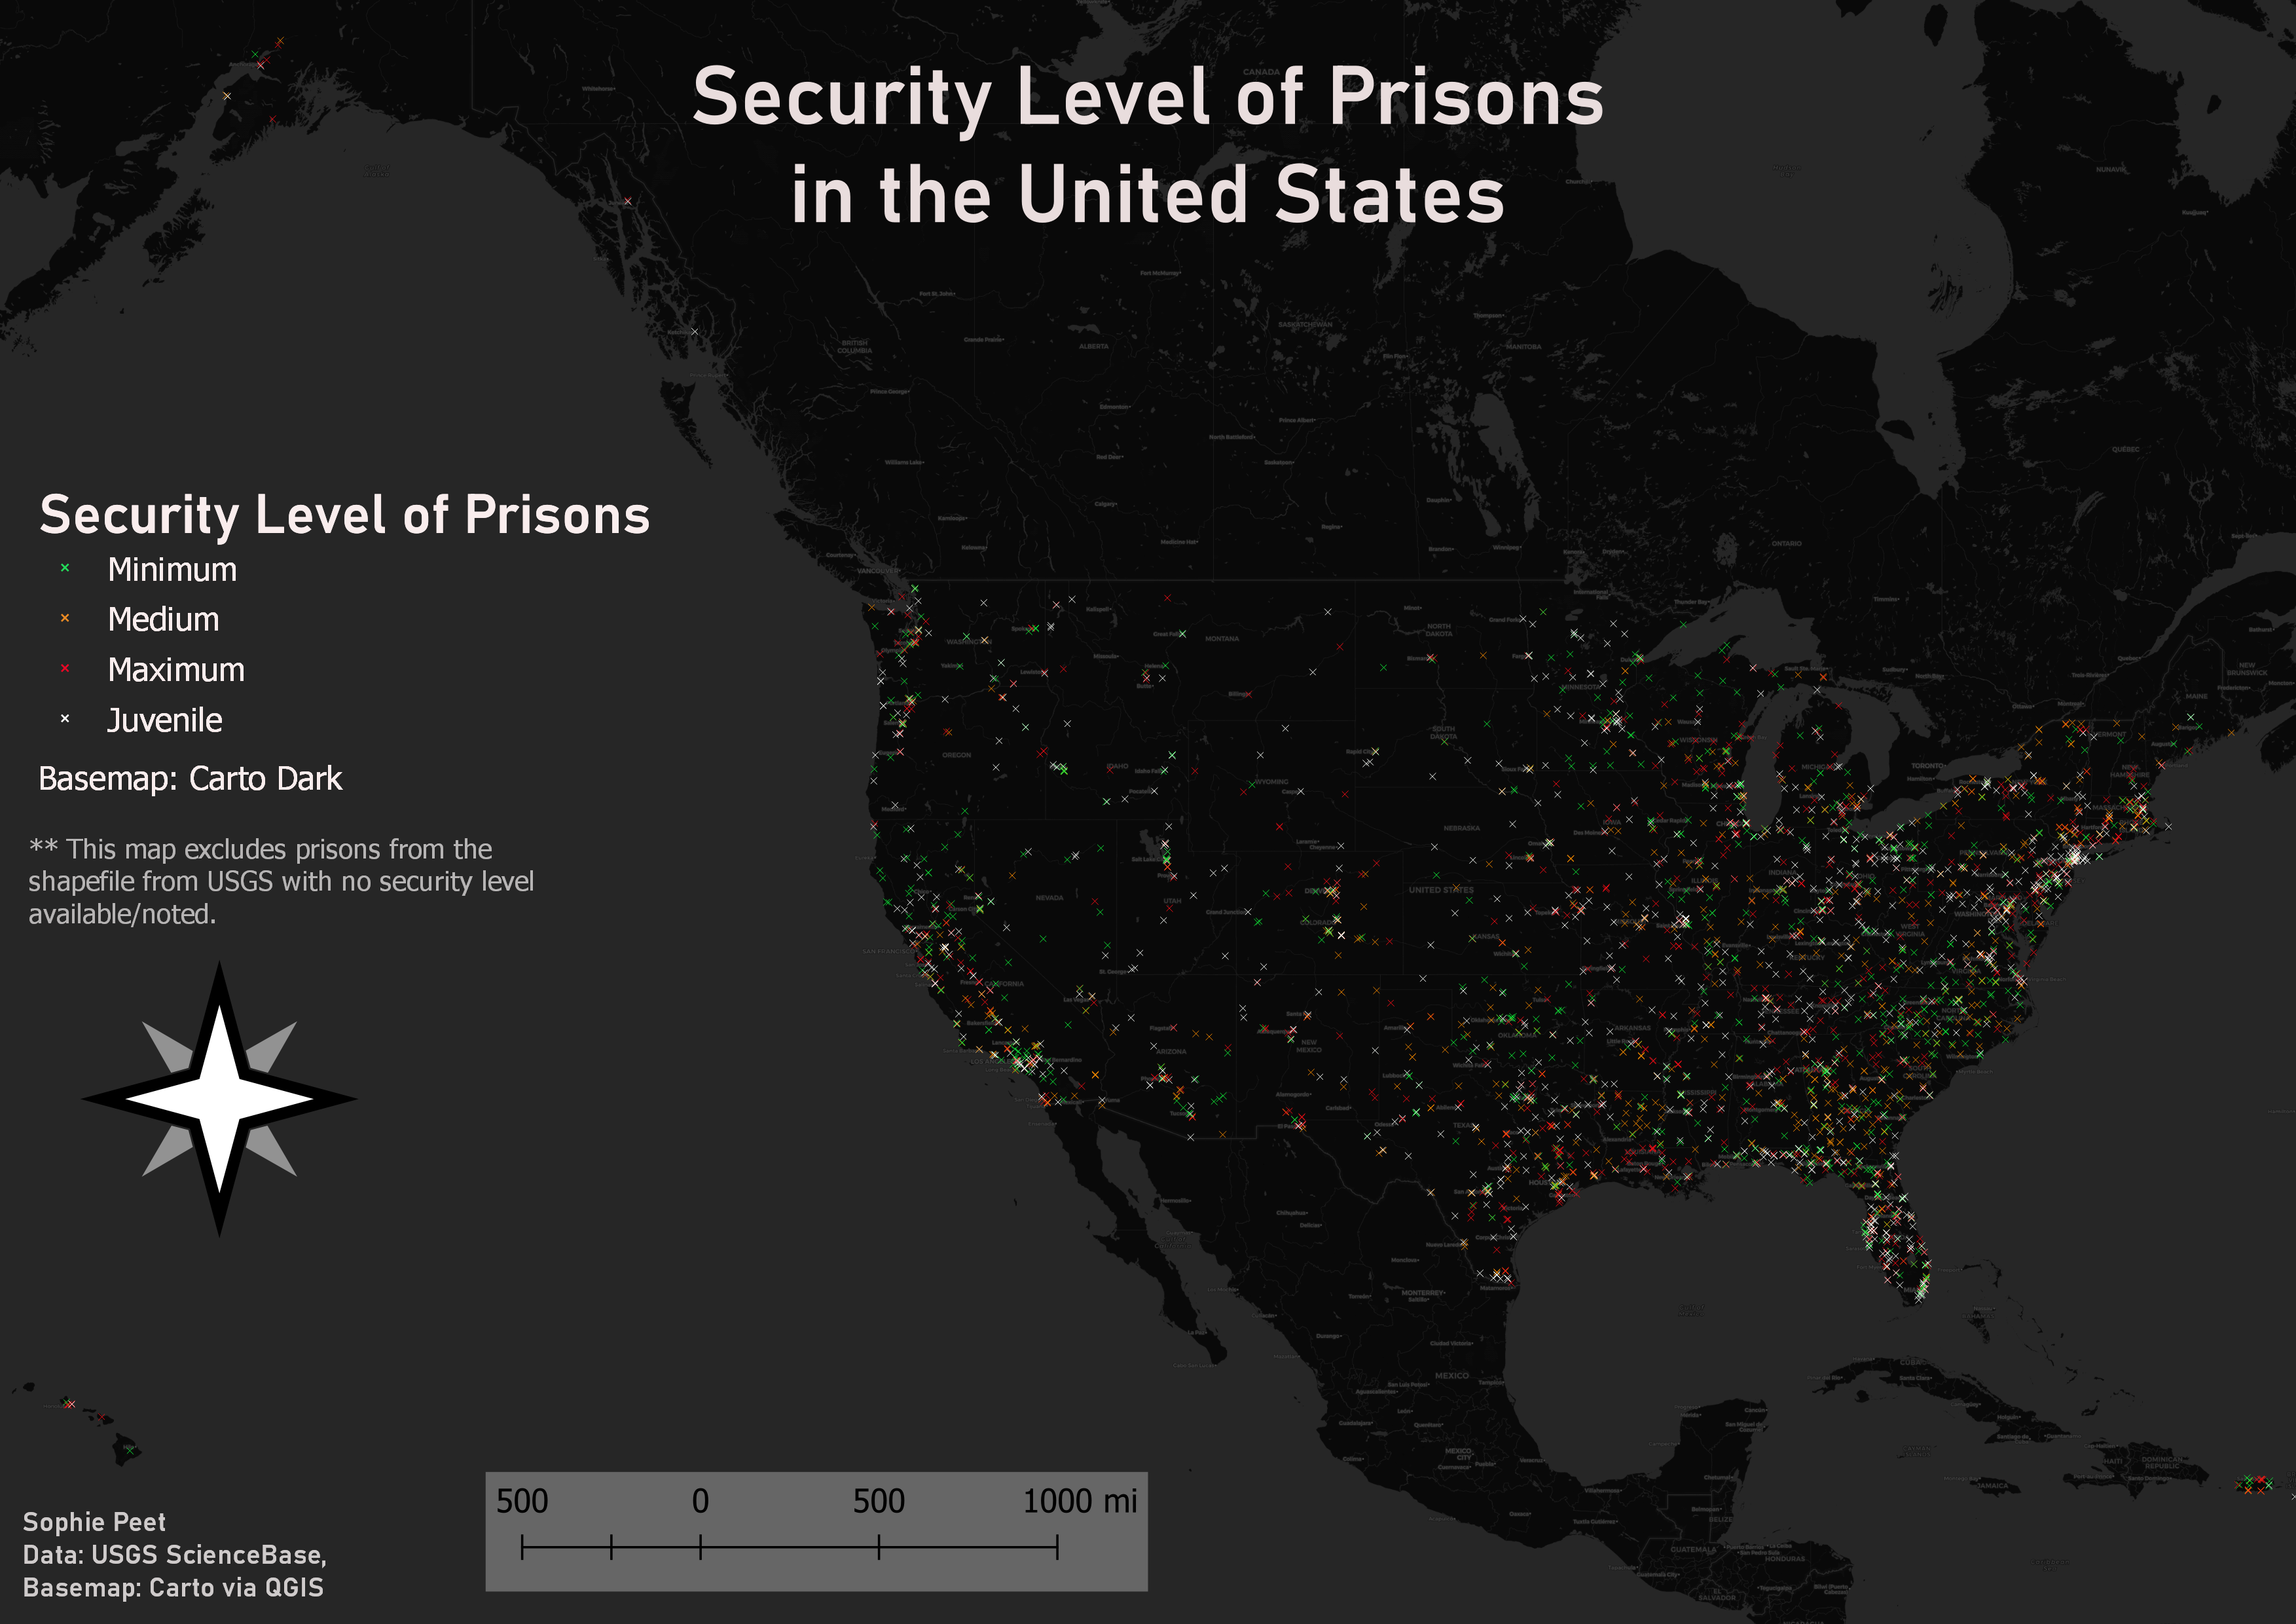
When we try to explore the question of why are so many prisons concentrated in the Mid-Atlantic region and Southeast when most of the incarcerated population is in the South. This is when we have to look at outside factors concerning racial makeup of each state, racial makeup of each prison, type of crimes commited in each region, and level of security in each prison.
Vector Analysis
-
For the United States, state layer rendering there was data collected from prisonpolicy.org, on the number of people incarcerated per state. This data was added to the attribute table, creating a new field, and using this to categorize the data, in a simple choropleth map layer.
-
I retrieved a prison shapefile from USGS ScienceBase, with all of the prison locations/areas in the United States. I then used the centroid tool (Vector-Geometry tools) to create points for each of the prison polygons.
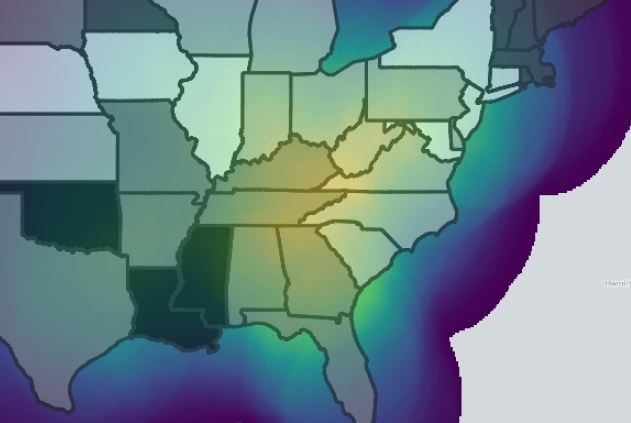
Raster Analysis
I used the centroid points from the previous vector conversion and used the Kernel Density Tool with a radius of 10 to create a heatmap for the point layer, as a better representation spatially. I chose a Purple to Yellow “Virids” color scheme for this underneath the grays I used for the choropleth layer. I chose a transparency of 70% for the choropleth layer so you are able to draw conclusions by making connections between the two layers.