GIS Portfolio
Projects
The Food Landscape of Maryland

Spread of Food Stores within Maryland, Comparative Analysis to Average Household Income
This series of maps takes data on the location of food stores in Maryland and manipulates it using Python and QGIS. They show the percentages of each type of grocery store for the two counties with the highest average household incomes (Howard and Montgomery County) and the two counties with the lowest average incomes (Worchester and Somerset County).
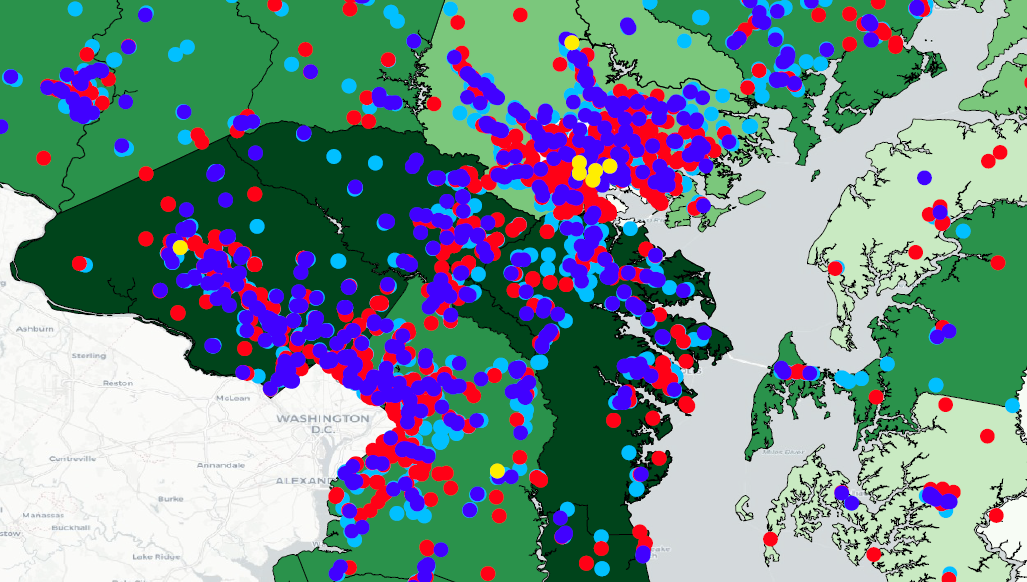
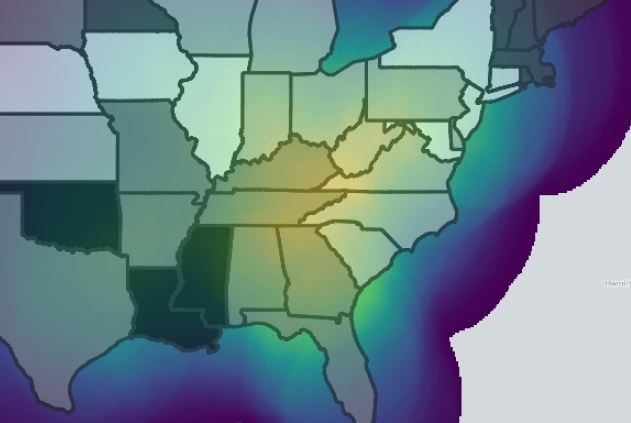
Comparison of Tweets Across the United States Containing “‘COVID19’ or ‘Trump’”
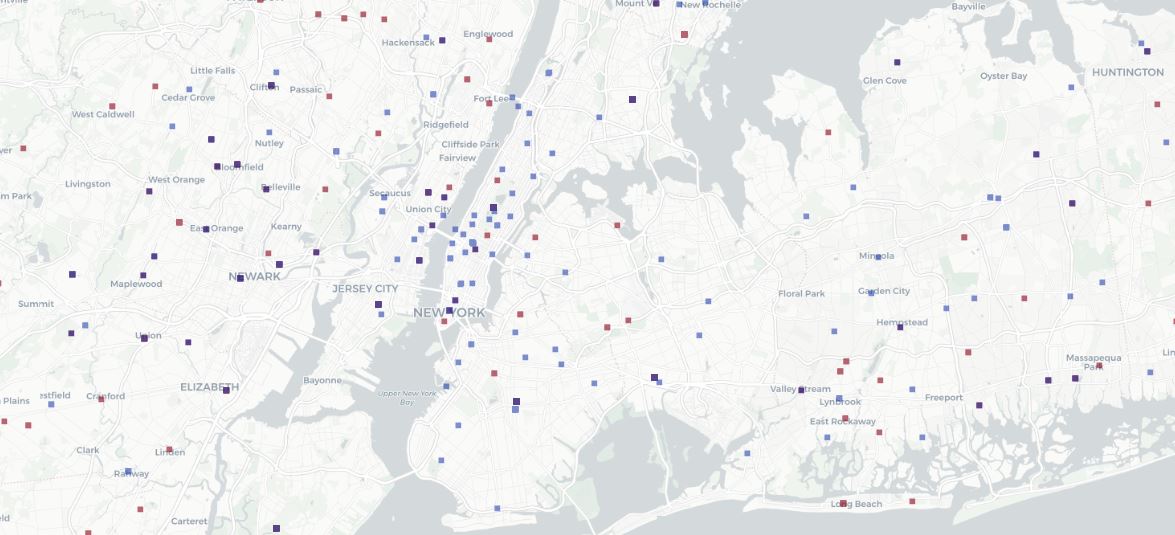
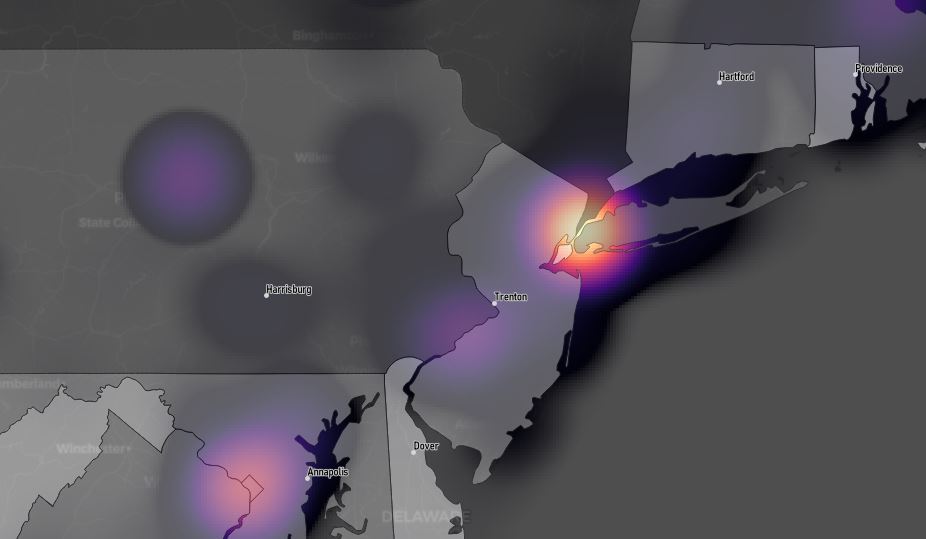
These maps take data gathered form Twitter’s API via R, to compare tweets containing the kewyord “COVID19” or “Trump”, they are depicted in several different ways. The first map in this series shows the raw data gathered, with each tweet shown as a point on the map. The second map shows two different wasy to visualize the data spatially, they are shown by a density factor and a count per polygon (state) factor.
Number of Prisons and Rates of Incarceration per State in the United States
This map explores prisons in the each state of the United States two ways; rate of incarceration(per 1000 people) and number of prisons in each state. This map was created using vector and raster analysis to have the viewer interpret the data as a comparison between these two factors.
Effect of Highway Proximity on Visitors to National Parks
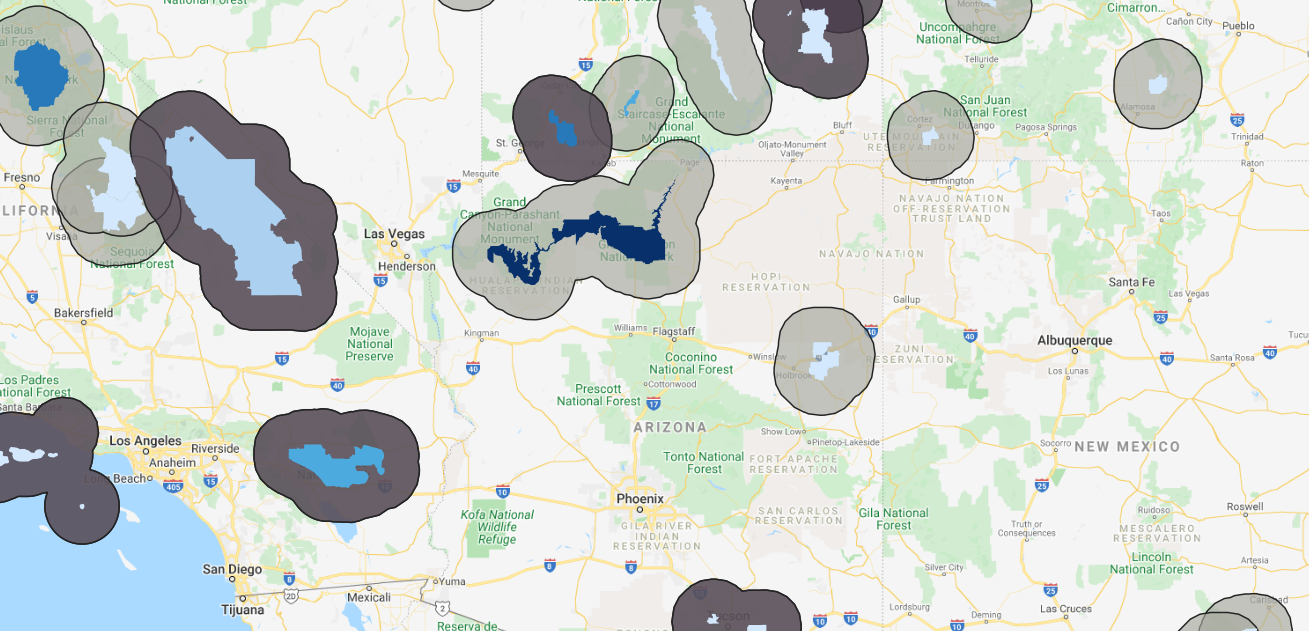
This is an interactive webmap created in QGIS using data from the National Park Service (NPS) and the United States Census Bureau, and Google Mpas Basemap. The purpose of this map to see if proximity to a highway affects the amount of people that visit a given national park in a year (visitor data, 2018).