Food Store Types and Spread Across Maryland
Counties Studied: Montgomery County, Howard County, Somerset County, Dorchester County
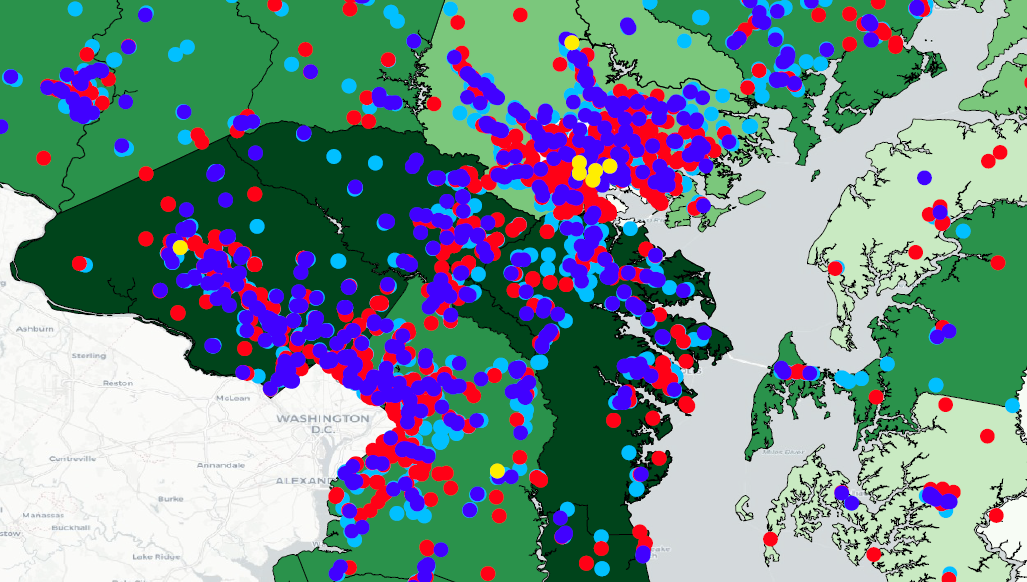
This project focuses on the food store spread around Maryland in 4 different counties. These counties were selected as the highest 2 and lowest 2 average household incomes of all 24 counties in Maryland. Below you will see a map depicting the location of food stores symbolized based on type and the spread of household income of all 24 counties. The four types of stores shown are: Convenience Stores, Public Markets, Small Grocery or Corner Stores, and Supermarkets. In the counties of interest only 1 county, Montgomery County, has a Public Market.
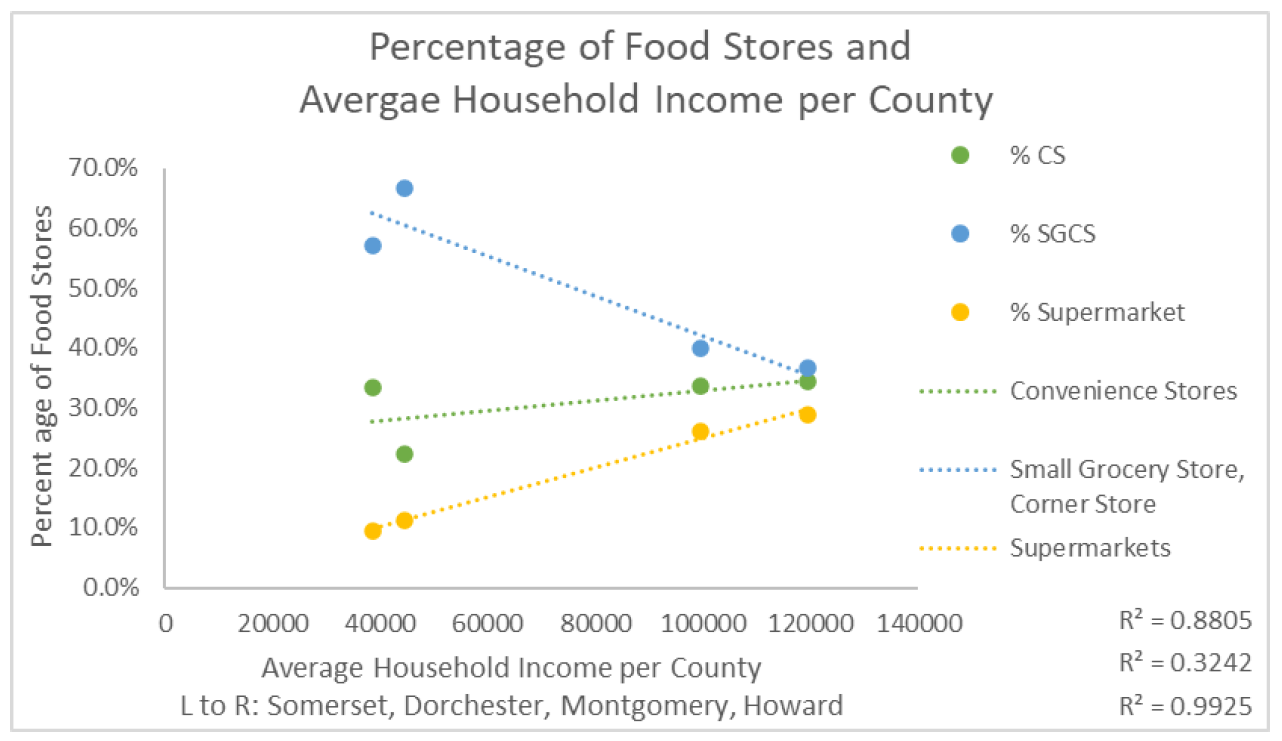
The next map shows the counties of interest for this study. It is supplemented by two graphs and a descirption for these graphs. These graphs were created by exporting the merged attribute table for the counties of interest layer and manipulating the data in Microsoft Excel. These graphs show the relationship between the percentage of each type of food store per county to county population and average household income(AHI) per county. The counties of interest were chosen because of the strong correlation based on an R-squared value derived from a trendline, between AHI and percentage of each type of store. As avg. HH income increases the percentage of supermarkets increase (R-squared value 0.9925) compared to an R-squared value of 0.4992 comparing to county population. The percentages of convenience stores to AHI or population R-squared correlation values are 0.3242 and 0.2016, respectively, there is not a “huge” difference here but correlation for AHI is about 50% higher than correlation for population. The last comparison is between Small Groceries and Corner Stores and AHI or Population. The R-squared correlation coefficient for AHI to Small Groceries is 0.8805 and the correlation coefficient for Population to Small Groceries is 0.4749. Both of these are correlated negatively as income increases Small Groceries decreases. The correlation values for AHI are significantly higher than the population values, which will prove more interesting and relevant comparisons between counties.
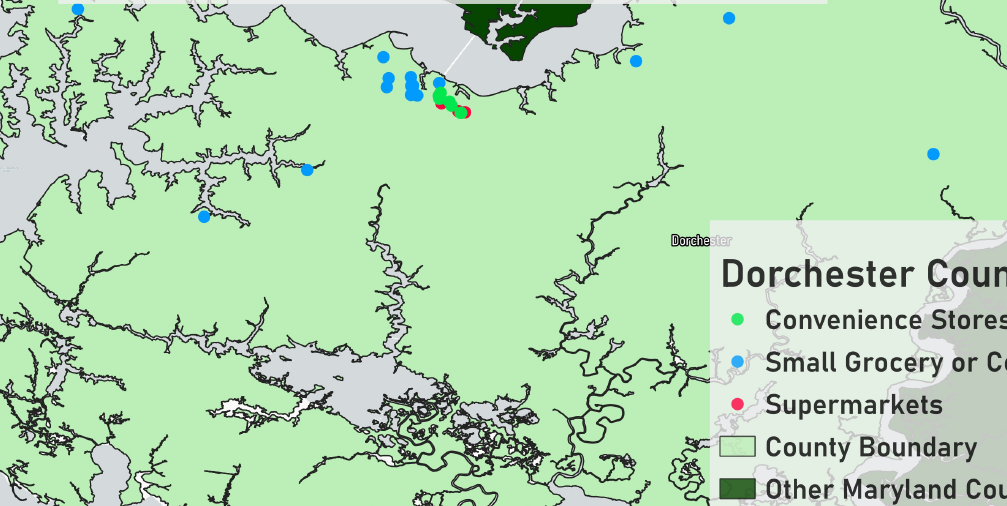
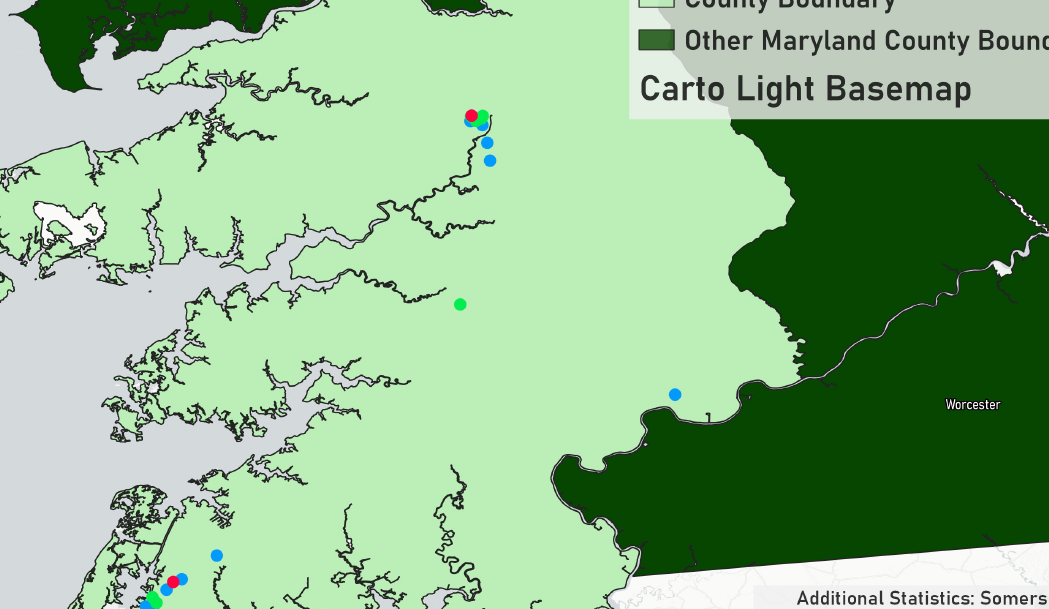
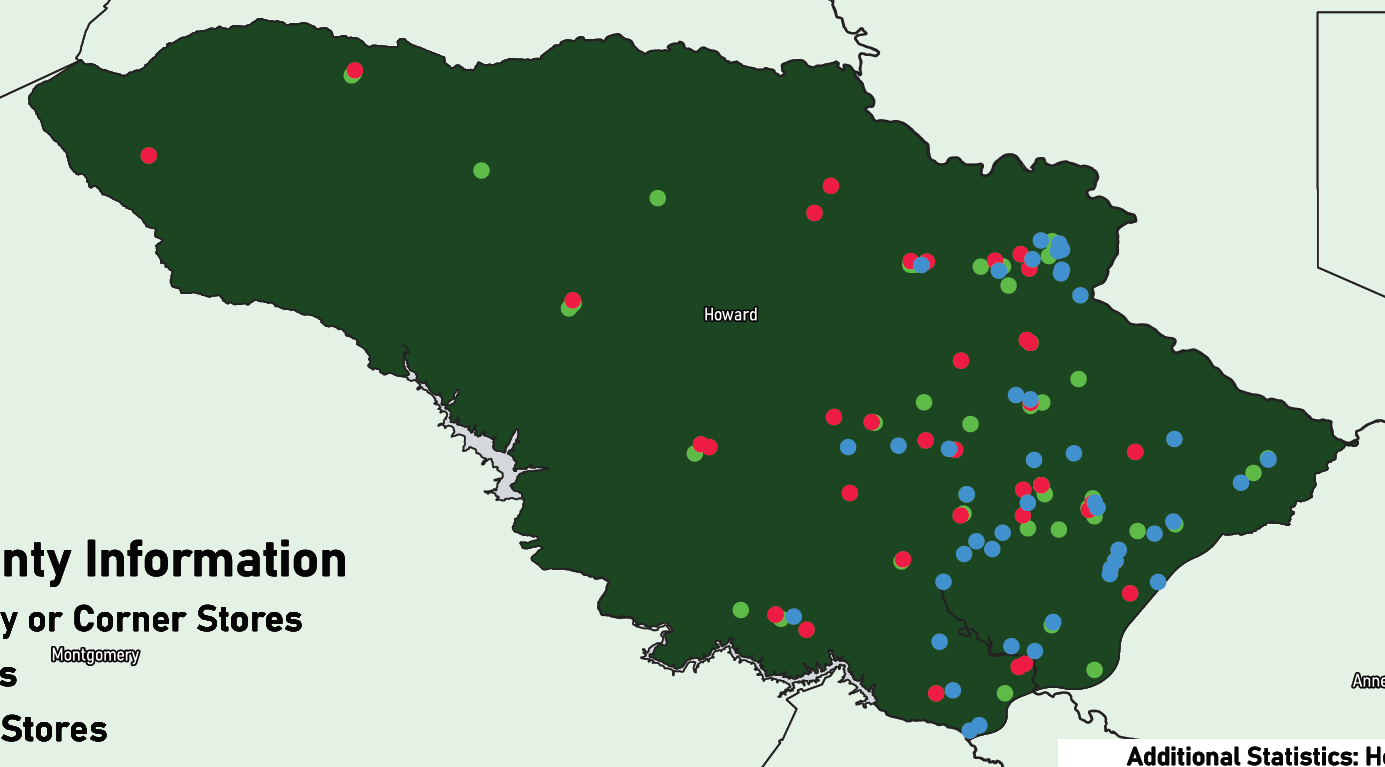
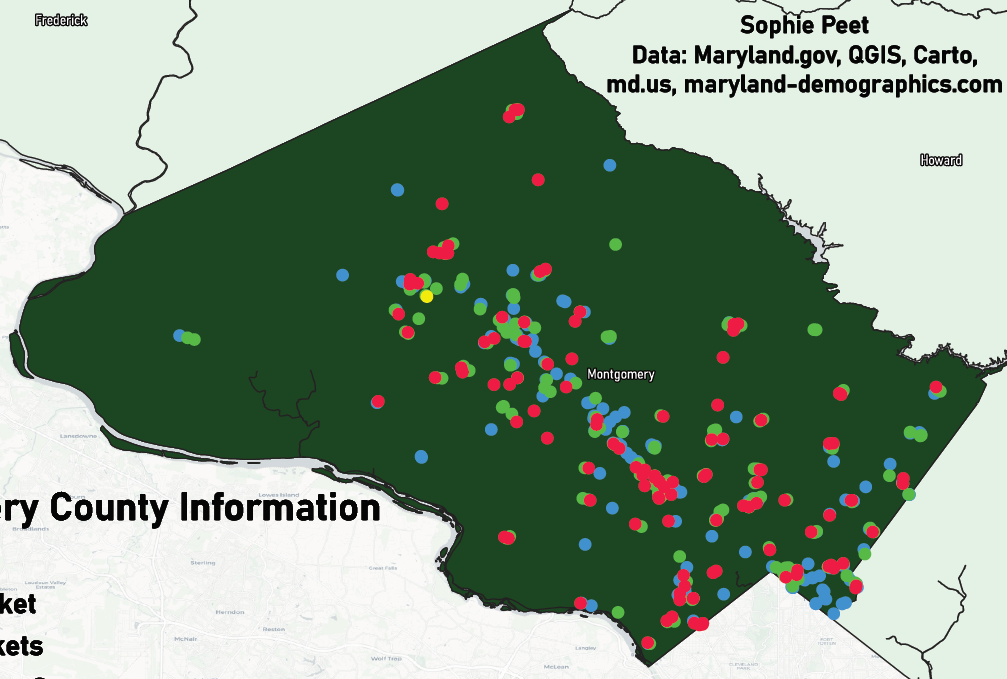
Each map below was created using a series of scripts using Python in QGIS. (Link to code below). Some functions used via Python are: Select by Expression, Field Calculator and Adding Attribute Fields, Save New layer, Clip Points to a Polygon, and Count Points in a Polygon. This series of maps shows the “counties of interest” in more depth with the locations of all of their food stores, and includes additional statistics for each county. One noteable statistic, that can also be seen in the graphs is each county has the highest percentage of Small Grocery Stores and Corner Stores.
Howard County
Montgomery County
Dorchester County